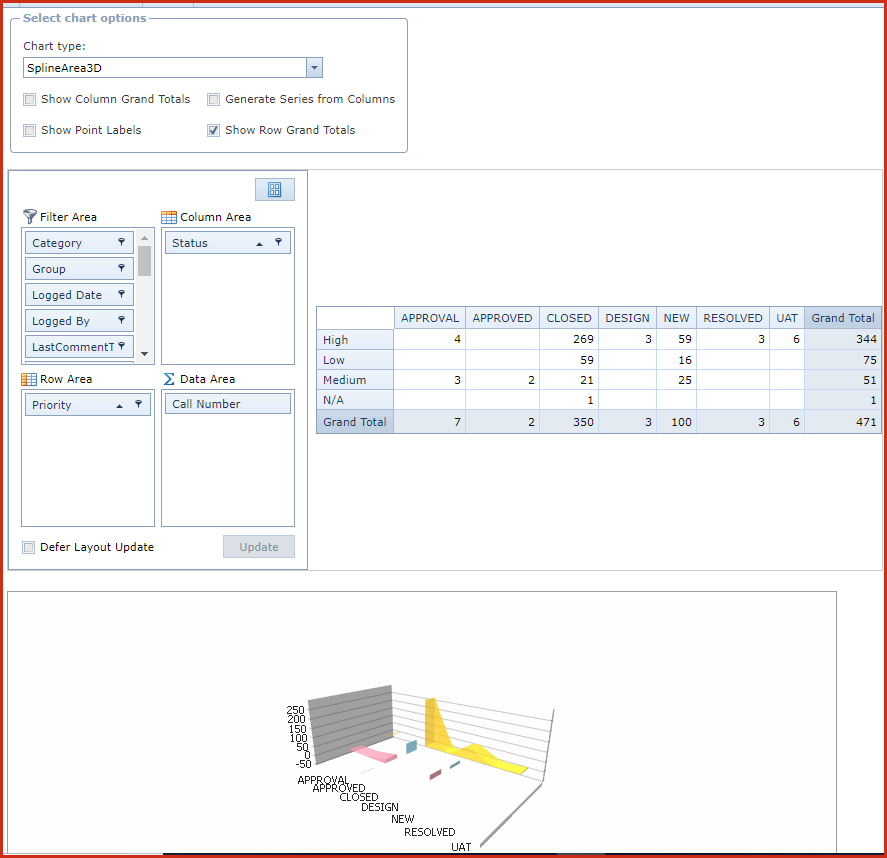
Call Pivot Analysis to used to generate charts to extract information on Helpdesk
calls.
Steps to generate charts.
-
Go to the "Select Chart Options"
section.
-
Select the "Chart Type"
-
Check the chart option for the chart label.
-
Tick the "Check Box".
-
Filter the data for the chart:
-
"Filter Area" and "Data Area" contains list of
data can be included in the chart.
-
"Column Area" and "Row Area" will printed the selected
data in the chart.
-
Drag and drop the required data from the "Filter Area" and "Data Area" to "Column Area"
and "Row Area" sections.
-
A table will be generated next to the filters to show
the data count.
-
The graph will be updated with the data filtered in 2
above.
Figure 1: Pivot Analysis